Abstract
In humans, psychological stress is positively correlated with an increased desire for certain energy-dense food items, indicating that stress may trigger foraging behavior that adapts to perceived current and future resource availability. However, the extent to which such processes influence desire for different kinds of foods remains unclear. Here, we examine the effects of perceived environmental conditions on food preferences across the food spectrum of dairy, meats, vegetables, fruit, grains, and sweets. We first showed images of 30 different food items to participants and recorded their stated desire to eat each kind of food. We then repeated this procedure after exposing participants to cues of either a harsh or a safe environment. As predicted, we found cues of environmental harshness increased the desirability of energydense food items. However, there was also evidence for decreased desirability for energy-dense food items following exposure to cues of a relatively safe environment. Our findings indicate that simple manipulations of perceived environmental conditions may trigger changes in desire for different kinds of food. Our study has relevance for increasing efforts to understand eating behavior in order to promote uptake of healthier diets.
Key Words Food preference. Optimal foraging. Harsh environment. Stress . Evolutionary consumption. Life history theory
Introduction
Humans are thought to have evolved in environments where food was often scarce and its availability varied seasonally. As in other animals, humans have a propensity to over-eat when food is readily available and the ability to store excess energy as fat. These excess fat stores can then be drawn upon during future food shortages (Kardum et al. 2008; Korte et al. 2005; Zafon and Simo 2011; Saad 2011). Natural selection would also likely favor preferences among different food items, with positive selection for preferences which maximize caloric intake rate – this logic is the foundation of optimal foraging theory (Dusseldorp 2012; Lieberman 2006; Pinel et al. 2000; Pyke et al. 1977).
Furthermore, physiological and psychological mechanisms may lead to adaptive foraging behavior that is sensitive to current local resource availability and environmental cues of how this availability may vary in the future. For example, stress responses can be triggered when an individual senses a threat, real or implied, to its psychological or physiological well-being. The stressor can be sensed in the present moment or anticipated at some future time (Greenberg et al. 2002) and can be perceived and take effect subconsciously (Adam and Epel 2007; Tamashiro et al. 2006). Acute stress and chronic stress influence the desire to eat in different ways. Acute stress triggers the suppression of appetite and hunger (Sinha and Jastreboff 2013; Torres and Nowson 2007); perhaps because it would be counter-productive for an organism to engage in food search while at the same time trying to remove an immediate threat (Dagher 2009). In comparison, chronic stress increases appetite and hunger (Born et al. 2009). Chronic stress results from experiencing unfavorable conditions over an extended period of time, such as persistent concern about where the next meal will come from and concerns about personal safety. Chronic stress therefore increases appetite while at the same time functioning as a mediator in directing food selection toward energy-dense food (Dagher 2009; Torres and Nowson 2007; Dallman et al. 2003). Energydense foods, which are often high in fat and sugar, are also preferred during times of chronic stress because they stimulate dopamine production in the brain’s reward center. The increase in dopamine produces a pleasurable feeling (Carter 2009) which leads to a decrease in cortisol production, repairs one’s mood, and helps return the body to a homeostatic state (Sapolsky 2004; Adam and Epel 2007; Sinha and Jastreboff 2013).
Food Preferences and Environmental Conditions
In general, relatively harsh environments are associated with increased exposure to pathogens, inhospitable climate and weather, and scarcity of resources such as food (Brumbach et al. 2009). Humans may subconsciously detect cues of environmental harshness and up-regulate attention toward scarce resources needed for survival. In response to cues of environmental harshness, people may exhibit risk-averse behaviors and seek-out and consume energy-dense foods to build fat reserves, which can serve as a buffer against the possibility of future food shortages (Torres and Nowson 2007). There is some evidence that resource availability during childhood, in particular, may also shape subsequent behavior in later life, possibly by altering an individual’s life history trajectory (Griskevicius et al. 2013).
Laran and Salerno (2013) conducted an experiment to directly investigate the effects of cues on environmental adversity on people’s eating behavior. They found that when participants were exposed to words such as “shortfall” and “adversity,” individuals consumed more of a food item that they were led to believe contained higher calorific value (“high-calorie” versus “low-calorie” M&M candies). On the other hand, when participants were exposed to neutral words, consumption was unaffected.
Here, we extend this approach to investigate how cues of environmental conditions might alter preferences across a wider range of food items which vary in nutritive value. We developed an experimental procedure to test how the perception of environmental harshness influences preference for different food items across the six primary food categories (vegetables, fruits, grains, dairy, meats, and sweets). We measured food preference by having participants look at images of food that were displayed on a computer screen in random order. Next, the participants were asked to rate how much they would currently like to eat each food item. Participants completed this task twice, before and after exposure to a stimulus which aimed to manipulate their perception of environmental harshness. Half the participants were randomly assigned to the “harsh scenario,” which involved reading a text passage that involved a young woman describing her living conditions which included phrases describing poor economic/employment, social support, and personal safety conditions.
Our experimental design differs from that of Laran and Salerno in several critical respects. First, we can address the question of whether the influence of perceived environmental severity might generalize across a range of food items of variable nutritive value. Second, it allows us to test whether the effect of increased desirability of high-calorie foods extends to people’s implicit judgments of nutritive value, rather than their decision-making when calorific value is explicitly highlighted. Third, we use a within-subjects design, which allows us to control for a range of individual differences, for example in food preferences and current hunger, which could potentially have influenced Laran and Salerno’s results. Fourth, rather than focusing solely on environmental harshness by comparing associated words against neutral controls, we explicitly compared scenarios of harsh versus safe environments. This distinction opens up the possibility to test not just the predicted effects of harsh environments on increased desire for high-calorie foods, but also the opposite effect in which the potential for decreasing desire for high-calorie foods might be elicited. This aim is of particular interest in the context of attempts to use evolutionary insights to change behavior in order to promote a healthier diet in contemporary society (e.g., Roberts et al. 2012; Whitehead et al. 2012), and was made possible because our within-subjects approach allowed us to compare change in behavior before and after exposure to cues of both kinds of environmental condition.
Based on the above-reviewed previous research, we hypothesized that cues of environmental harshness would trigger changes that might reflect changing strategies in consumptive behavior, particularly of increased preference for high-calorie food items. Furthermore, we hypothesized that cues of a safe or benign environment might trigger decrease in desire for high-calorie food types.
Methods
Participants
This experiment comprised a total of 167 participants from a large Canadian university. Participants included both students and support staff. Students received a course research participation credit for participating. Participants were told that the purpose of the study was to investigate influences on food preferences. In keeping with prior research, a questionnaire administered at the end of the experiment aimed to identify whether participants had any form of food allergy, were vegetarian/vegan, or had religious beliefs that influenced their food choices. If a participant stated “yes” to any of the above questions, they were excluded from the analysis. This left 126 participants in the final analysis, of whom 70 participants (25 men, 45 women) were randomly allocated to the safe scenario condition and 56 participants (34 men, 22 women) were allocated to the harsh scenario condition.
Procedure
Having provided informed consent, participants were provided with a URL to the online experiment. They were then shown images of 30 food items, as displayed in Fig. 1. These images constituted five items from each of the major food categories (vegetables, fruits, grains, dairy, meat/poultry, and sweets); original images are available from the authors on request.
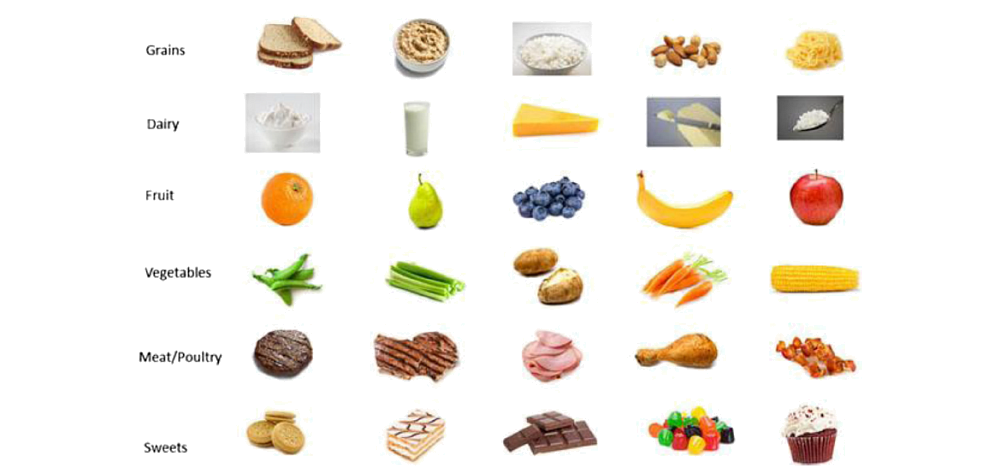
Fig. 1 Food images used in experiment. Images were shown individually and in randomized order. They include five examples of each of six main food groups: grains (from left to right: bread, oatmeal, rice, peanuts, spaghetti), dairy (ice cream, milk, cheese, butter, cottage cheese), fruit (orange, pear, blueberries, banana, apple), vegetables (peas, celery, potato, carrots, corn), meat (hamburger, steak, ham, chicken, bacon), and sweets (cookies, pastry, chocolate, candy, cupcake)
Images were presented in a different randomized order for each participant. Participants viewed each image and rated it according to the following question which was displayed below the image: “How desirable is this food item to you right now?” Ratings were recorded using a 7-point Likert-type scale (anchored with the descriptors 1=extremely undesirable and 7=extremely desirable).
After the 30 food items had been rated for preference, participants were randomly assigned to either the “safe” or “harsh” environmental condition. They were asked to read a scenario text (see Appendix 1). Scenarioswere adopted from a study by Little et al. (2007) who used them to test facial preferences under hypothetical high and low harsh environmental conditions. Each scenario depicted circumstances including elements concerned with a social environment, level of social support networks, and current economic well-being. Each text concluded with a statement forecasting future social and personal economic conditions (note, there was no direct mention of food availability in either scenario). Participants were then asked to imagine how they would feel if this was their situation. Once the allocated scenario had been presented, the participants were asked to rate the same 30 food items for a second time. The food images were presented in a new randomized order. Finally, participants completed a background questionnaire to obtain demographic details.
Results and Discussion
First, we tested whether participants’ exposure to the safe or harsh environment scenario would alter overall food desirability across the 30 food items. We used repeated-measures ANOVA to test for changes in participants’ scores before and after the scenario manipulation (Test), with pre- and post-exposure scores for the 30 food items nested within Food Group (6 levels: meat, vegetables, fruit, dairy, grains, sweets), and with Scenario (safe, harsh) as a between-subjects factor. We found a significant Test x Scenario interaction, F(1, 124)=10.45, p=.002; while pre-exposure and post-exposure scores were similar for participants exposed to the safe scenario, post-exposure scores increased among participants who were exposed to the harsh environmental scenario (Fig. 2).

Fig. 2 Mean (± sem) “desire to eat” scores across 30 foodstuffs, measured pre-exposure (open bars) and post-exposure (gray bars) to a scenario depicting either a safe or harsh environment. Scores increased post-exposure only when participants were exposed to cues of harsh environments; the interaction is significant (p=.002)
Furthermore, the Test x Scenario x Food Group interaction was also significant, F(5, 620)=13.68, p<.0001), such that changes in food desirability scores changed after exposure only in the harsh environment and that these changes varied across food groups. As shown in Fig. 3, desirability scores were considerably higher following exposure to harsh environment cues for meat and sweets, and somewhat higher for grain, while desirability of vegetables and dairy did not change and was somewhat reduced for fruit.
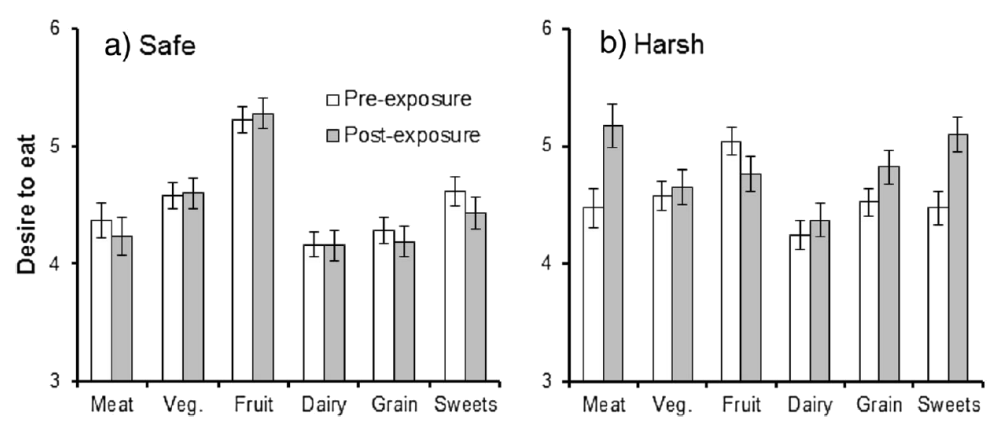
Fig. 3 Mean (± sem) “desire to eat” scores across six major food groups, measured pre-exposure (open bars) and post-exposure (gray bars) to a scenario depicting either a safe or harsh environment. Scores do not alter following exposure to cues of a safe environment, but changes occurred across different food groups following exposure to cues of a harsh environment.
We also re-ran the model to include gender of participant as a between-subjects factor. The main effect of Gender was not significant (p=.14), nor were there any significant interactions involving Gender and Scenario (p<.4), and all the other interaction effects reported from the first model remained significant. This indicates that men and women responded similarly to the experimental manipulation.
Next, we investigated whether this effect was driven by a change in preference for energy density among the individual food items by examining items in relation to calorific value. We determined the calorific values of the 30 food items using the dataset of the British Nutrition Foundation (http://www.nutrition.org.uk/healthyliving). We then split the 30 foods into two equally sized groups (Energy Value, 15 “high-energy” foodstuffs, 15 “low-energy” foodstuffs) based on their calorific value (see Table 1), and included this as a withinsubjects factor in repeated-measures ANOVA. This analysis revealed a significant Test x Scenario x Energy Value interaction, F(1,14)=28.46, p<.0001, such that desirability scores decreased after exposure to the safe scenario while, in contrast, they increased post-exposure to cues of environmental harshness, but only in the high-energy food group (Fig. 4).
Table. 1 Standard energy content of the presented food items (in calories per gram)
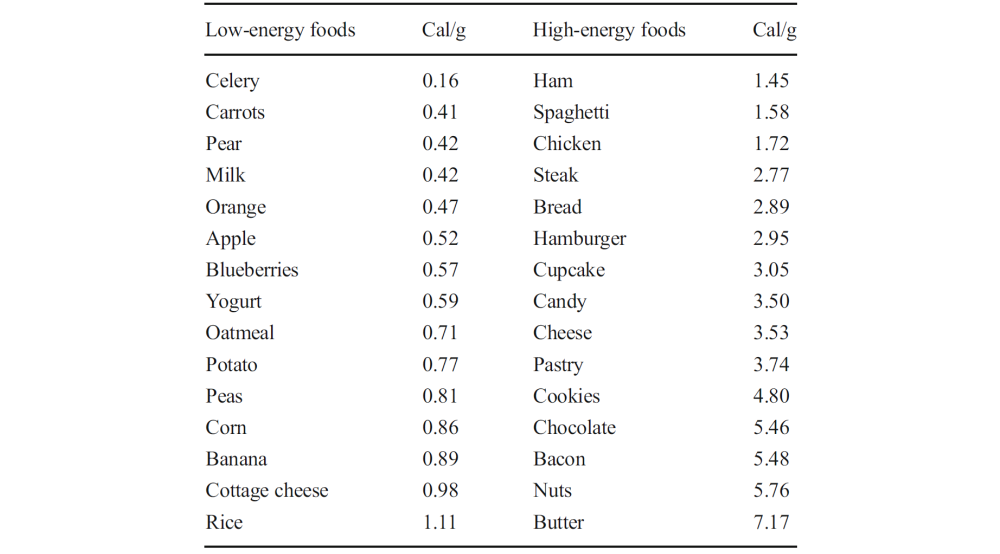
Data come from the British Nutrition Foundation (2009). Although the British Nutrition Foundation defines low-energy foods as those having ≤1.5 cal/g, here, we classified “ham” as a high-energy food to produce equally sized samples of low-energy and high-energy foods-results are qualitatively identical if ham is reassigned as a low-energy food item.

Fig. 4 Mean (± sem) “desire to eat” scores across measured pre and post-exposure to a scenario depicting either a safe or harsh environment, across 15 lowenergy and 15 high-energy food items. While scores decreased post-exposure to the “safe environment” scenario, scores increased following exposure to cues of a harsh environment, but only for high-energy food items; the interaction is significant (p<.0001) Evolutionary Psychological Science.
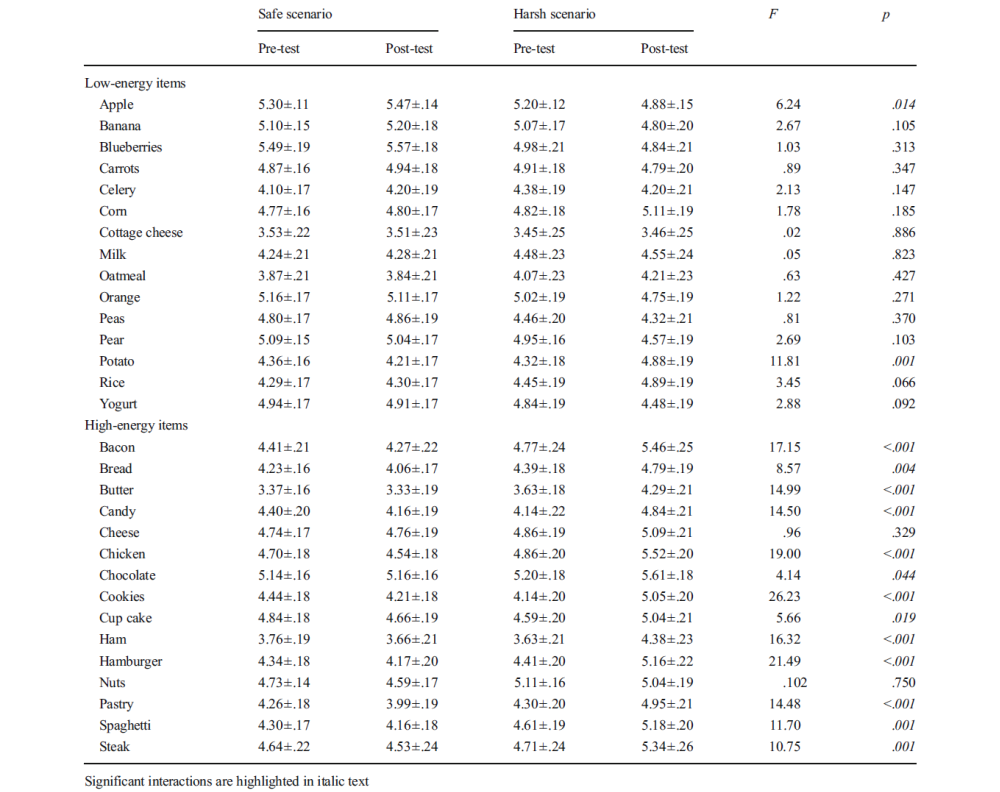
Results from the analyses for individual food items (Table 2) support this: there was a significant interaction effect for 13 of the 15 “high-energy” food items (in the same pattern as shown in Fig. 4), but this was markedly different among the “low-energy” food items. Here, only one foodstuff (potato) followed a similar pattern with a significant interaction effect, with scores for rice being marginally significant. The only other significant interaction among the low-energy foods was a significant decrease in desirability for the lowest energy value food, apples, after exposure to cues of environmental harshness.
Table. 2 Mean (± sem) scores for individual food items pre- and post-exposure to scenarios depicting safe or harsh environments.
Calorific value thus appears to be positively associated with the extent to which people desired specific foodstuffs following cues of harsh environments. We analyzed this further by examining changes in desirability for individual food items. We first calculated change in desirability by subtracting mean desirability scores for food items before the manipulation from the equivalent scores given by participants after the manipulation (positive change indicates a food item is given higher scores following the manipulation). We then correlated change in desirability scores for food items with their calorific value. This analysis revealed that, in participants exposed to cues of a harsh environment, change in desirability of food items was positively correlated with their calorific value (r=.576, n=30, p=.001). In contrast, the reverse was found for participants exposed to the safe scenario (r=−.492, n=30, p=.006), indicating that desire for higher-energy foods may be reduced by cues of benign environmental conditions (see Fig. 4a). This analysis reveals that cues of environmental conditions may both increase and decrease desire for high-energy foods, according to perceived future availability and need.
Interestingly, however, plots of these data revealed that these effects of calorific value on change in desirability scores were curvilinear rather than linear and that a quadratic function fitted the data better than a linear one (Fig. 5; safe: F(2,27)=14.63, p<.0001; harsh: F(2,27)=14.66, p<.0001; r2=.52 in each case, compared with .242 and .332 for linear functions in the safe and harsh scenarios, respectively). The curve was u-shaped in participants exposed to the safe scenario (function: y=-.135x+.017x+.092), and n-shaped in participants exposed to the harsh scenario (y=.428x-.050x-.257).
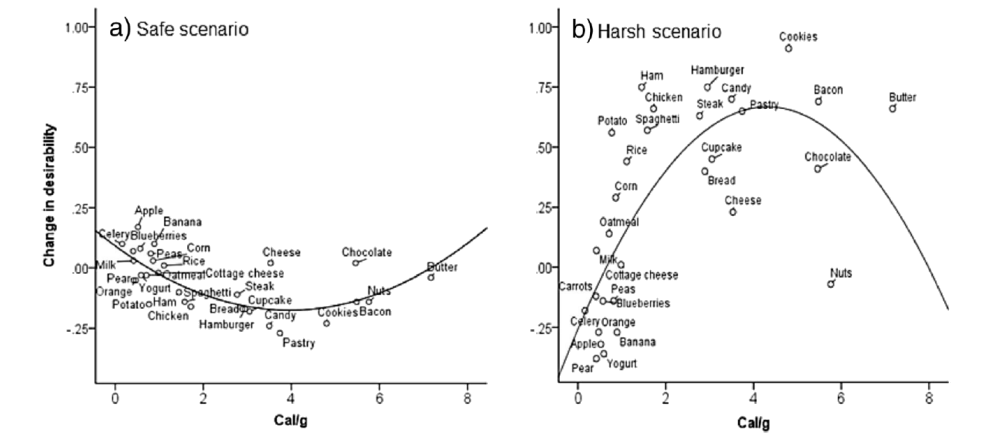
Fig. 5 Association between calorific values of 30 food items and mean change in “desire to eat” scores awarded to food items after viewing a scenario depicting either a safe (n=70 participants) or harsh environment (n=56 participants). Regression curves depict quadratic functions (r2=.52 in each scenario).
This suggests that the negative and positive effects, respectively, of calorific value on food item desirability following exposure to cues of safe and harsh environments were driven by food items of low to moderate calorific value only. Although food items with extremely high calorific value (i.e., cookies, chocolate, bacon, nuts, butter) followed the general pattern of other high-energy foods, the change in food item desirability associated with the scenario manipulation was relatively modest.
Conclusions
Our results add to the existing evidence that there is behavioral sensitivity to how people perceive their environment. For example, previous work, using the same textual scenarios depicting harsh or safe environmental conditions, has reported a potentially adaptive shift in female preferences from less masculine-looking male faces toward more masculinelooking faces under harsh environmental conditions (Little et al. 2007). Other studies have found changes in preference among different foods when participants are primed with words associated with deprivation or hardship (Torres and Nowson 2007; Laran and Salerno 2013). In our study, a simple text scenario describing either safe or harsh environmental conditions altered participants’ expressed desire to eat foods with relatively high calorific value, even though there was no direct reference in either scenario to food availability.
Based on earlier research, we had predicted that environmental harshness would likely increase desire for energydense food items. However, we did not know whether this increased desire would be limited to energy-dense foods; that is, whether desire for food would increase across food items more generally. Our results suggest that there was no significant change in desire for foods that were relatively energypoor after exposure to the harsh environmental scenario, suggesting that the manipulation did not affect appetite generally. Thus, our results support the idea that harsh conditions increase perceptions of resource scarcity, which in turn triggers optimal foraging behavior such that attention is specifically directed toward high-calorific/high-motivation foods.
In addition, our data revealed two further interesting results. First, analyses using food item as the unit of analysis showed that, in contrast to the positive correlation between calorific value and increased desirability ratings of highcalorie food items in the harsh environment condition, there was an inverse relationship in the safe environment condition. This may suggest that cues of experiencing a safe and benign environment may serve to reduce attention toward higher calorific food items. As Figs. 4 and 5 show, this response was considerably less marked compared with the increased desire precipitated by the harsh environment cues, but the effect is nonetheless of interest. For example, it might be that a stronger effect would be obtained in participants from a population where standards of living are lower.
Second, the response in desire to food items varying in calorific value following exposure to cues of environmental harshness was curvilinear (Fig. 5b), indicating that although desire for extremely energy-dense items did increase, it did not increase as much as might have been expected. It may be that these items (including cookies, chocolate, and bacon) are so highly desirable that responses to them are relatively stable, in which case, stronger or more realistic scenario manipulationsmight be required to overcome “inertia” in preference for these items. Alternatively, these responses could be the result of a ceiling effect, such that there is less scope for increased desire in the post-exposure measures because expressed desire was already high in the pre-exposure measure. Further work may help to clarify this question, but consideration of the shape of the response curve in participants exposed to the safe scenario (Fig. 5a) is also relevant here. In this group, the same kind of effect (in this case, a floor effect) would not explain the relative stability of ratings for the same food items because higher ratings in the pre-exposure measure would mean that these items could potentially decrease even further than items rated only moderately desirable in the pre-exposure measure. Thus, we tentatively conclude that the relative stability in ratings of these items might be due to psychological affinity for these items as common comfort foods, which is difficult to overcome with simple scenario manipulations.
It should be acknowledged that while our study demonstrated that simple cues of environmental conditions influences food preferences, we cannot infer from this that manipulations of perceptions of environmental harshness or safeness would impact on actual caloric intake. Tests of actual consumption, rather than stated desire for food items, are a logical next step. Furthermore, it would be of interest to further disentangle the influence of cues of economic and social hardship, which were conflated in our scenarios. However, our results demonstrate that preference for different food items that vary in calorific value can be altered by simple and brief primes of prevailing environmental conditions, which has potential impact on strategies for behavior change aiming to tackle the obesity crisis and its associated implications for human well-being.
Appendix 1
Scenario 1-Safe Environment
“Imagine this is your situation. You are single, have a university degree, and do not have any children. Your parents and siblings are supportive and you get along well with them. You live in a neighborhood that is generally safe, relatively clean, quiet, and well maintained. Your neighbors are OK, either friendly or keeping to themselves. You have a stable job; as far as you can tell, you will remain employed for the foreseeable future. In general, you are happy at work and get along well with your boss and coworkers. Your job provides you with a steady income that meets your needs satisfactorily. You own your own home and are able to pay your mortgage on time. You have some savings and/or investments and look forward to a reasonably secure future. Imagine how this would make you feel for a few moments.”
Scenario 3-Harsh Environment
“Imagine this is your situation.You are single and you have no children. You left school at 16 years of age, which did not make your parents very happy, but that did not really matter since you did not get along with them anyway. In fact, you still do not get along with them and barely get along with your siblings. At best, your family relationships could be described as distant and at worst conflicted. You live in a neighborhood that is dirty and noisy. The community areas are not well maintained and some areas are even dangerous. Your neighbors are generally unfriendly or keep to themselves but a few are quite nasty and you don’t like running in to them, which is sometimes unavoidable. You recently lost your job because of a combination of economic cutbacks as well as conflicts with your boss and coworkers. You only started this job a few months ago, and so are faced with unemployment yet again. From your previous job searches, you know that work is limited and you have no idea when you will be employed again. You rent a home that needs repairs, but the landlord has refused to fix the problems, partly because you owe back rent. Fig. 5 Association between calorific values of 30 food items and mean change in “desire to eat” scores awarded to food items after viewing a scenario depicting either a safe (n=70 participants) or harsh environment (n=56 participants). Regression curves depict quadratic functions (r2=.52 in each scenario) Evolutionary Psychological Science And this is not the only bill that has gone unpaid. Imagine how this would make you feel for a few moments.”
Open Access This article is distributed under the terms of the Creative Commons Attribution License which permits any use, distribution, and reproduction in any medium, provided the original author(s) and the source are credited.
References
Adam, T. C., & Epel, E. S. (2007). Stress, eating and the reward system.Physiology & Behavior, 91, 449-458.
Born, J., Lemmens, S., Rutters, F., Nieuwenhuizen, A., Formisano, E., Goebel, R., & Westerterp-Plantenga, M. (2009). Acute stress and food-related reward activation in the brain during food choice during eating in the absence of hunger. International Journal of Obesity, 34, 172-181.
British Nutrition Foundation (2009). Retrieved from http://www.nutrition.org.uk/healthyliving/fuller/what-is-energy-density Brumbach, B. H., Figueredo, A. J., & Ellis, B. J. (2009). Effects of harsh and unpredictable environments in adolescence on development of life history strategies. Human Nature, 20, 25-51.
Carter, R. (2009). The Human Brain Book. DK Publishing.
Dagher, A. (2009). The neurobiology of appetite: hunger as addiction. International Journal of Obesity, 33, S30-S33.
Dallman, M. F., Pecoraro, N., Akana, S. F., La Fleur, S. E., Gomez, F., Houshyar, H., Manalo, S. (2003). Chronic stress and obesity: a new view of “comfort food.” Proceedings of the National Academy of Sciences, 100, 11696-11701.
Dusseldorp, G. L. (2012). Studying prehistoric hunting proficiency: applying optimal foraging theory to the Middle Palaeolithic and Middle Stone Age. Quaternary International, 252, 3-15.
Greenberg, N., Carr, J. A., & Summers, C. H. (2002). Causes and consequences of stress. Integrative and Comparative Biology, 42, 508-516.
Griskevicius, V., Ackerman, J. M., Cantú, S. M., Delton, A. W., Robertson, T. E., Simpson, J. A., & Tybur, J. M. (2013). When the economy falters, do people spend or save? Responses to resource scarcity depend on childhood environments. Psychological Science, 24, 197-205.
Kardum, I., Gracanin, A., & Hudek-Knezevic, H. (2008). Evolutionary explanations of eating disorders. Psychology Topics, 17, 247-263.
Korte, S. M., Koolhaas, J. M.,Wingfield, J. C., & McEwen, B. S. (2005). The darwinian concept of stress: benefits of allostasis and costs of allostatic load and the trade-offs in health and disease. Neuroscience and Behavioral Review, 29, 3-38.
Laran, J., & Salerno, A. (2013). Life-history strategy, food choice, and caloric consumption. Psychological Science, 24, 167-173.
Lieberman, L. S. (2006). Evolutionary and anthropological perspectives on optimal foraging in obesogenic environments. Appetite, 47, 3-9.
Little, A. C., Cohen, D. L., Jones, B. C., & Belsky, J. (2007). Human preferences for facial masculinity change with relationship type and environmental harshness. Behavioral Ecology and Sociobiology, 61, 967-973.
Pinel, J. P., Assanand, S., & Lehman, D. R. (2000). Hunger, eating, and ill health. American Psychologist, 55, 1105-1116.
Pyke, G.H., Pulliam, H. R., & Charnov, E. L. (1977). Optimal foraging: a selective review of theory and tests. Quarterly Review of Biology, 52, 137-154.
Roberts, S. C., van Vugt, M., & Dunbar, R. I. M. (2012). Evolutionary psychology in the modern world: applications, perspectives and strategies. Evolutionary Psychology, 10, 762-769.
Saad, G. (2011). The consuming instinct: what juicy burgers, Ferraris, pornography, and gift giving reveal about human nature. Amherst: Prometheus Books. Sapolsky, R.M. (2004). Why ZebrasDon’t GetUlcers. Times Books New York
Sinha, R., & Jastreboff, A. M. (2013). Stress as a common risk factor for obesity and addiction. Biological Psychiatry, 73, 827-835.
Tamashiro, K. L., Hegeman,M. A., & Sakai, R. R. (2006). Chronic social stress in a changing dietary environment. Physiology & Behavior, 89, 536-542.
Torres, S. J., & Nowson, C. A. (2007). Relationship between stress, eating behavior, and obesity. Nutrition, 23, 887-894.
Whitehead, R. D., Ozaakinci, G., & Perrett, D. I. (2012). Attractive skin coloration: harnessing sexual selection to improve diet and health. Evolutionary Psychology, 10, 842-854.
Zafon, C., & Simo, R. (2011). The current obesity epidemic: unravelling the evolutionary legacy of adipose tissue. The Open Obesity Journal, 3, 98-106.